
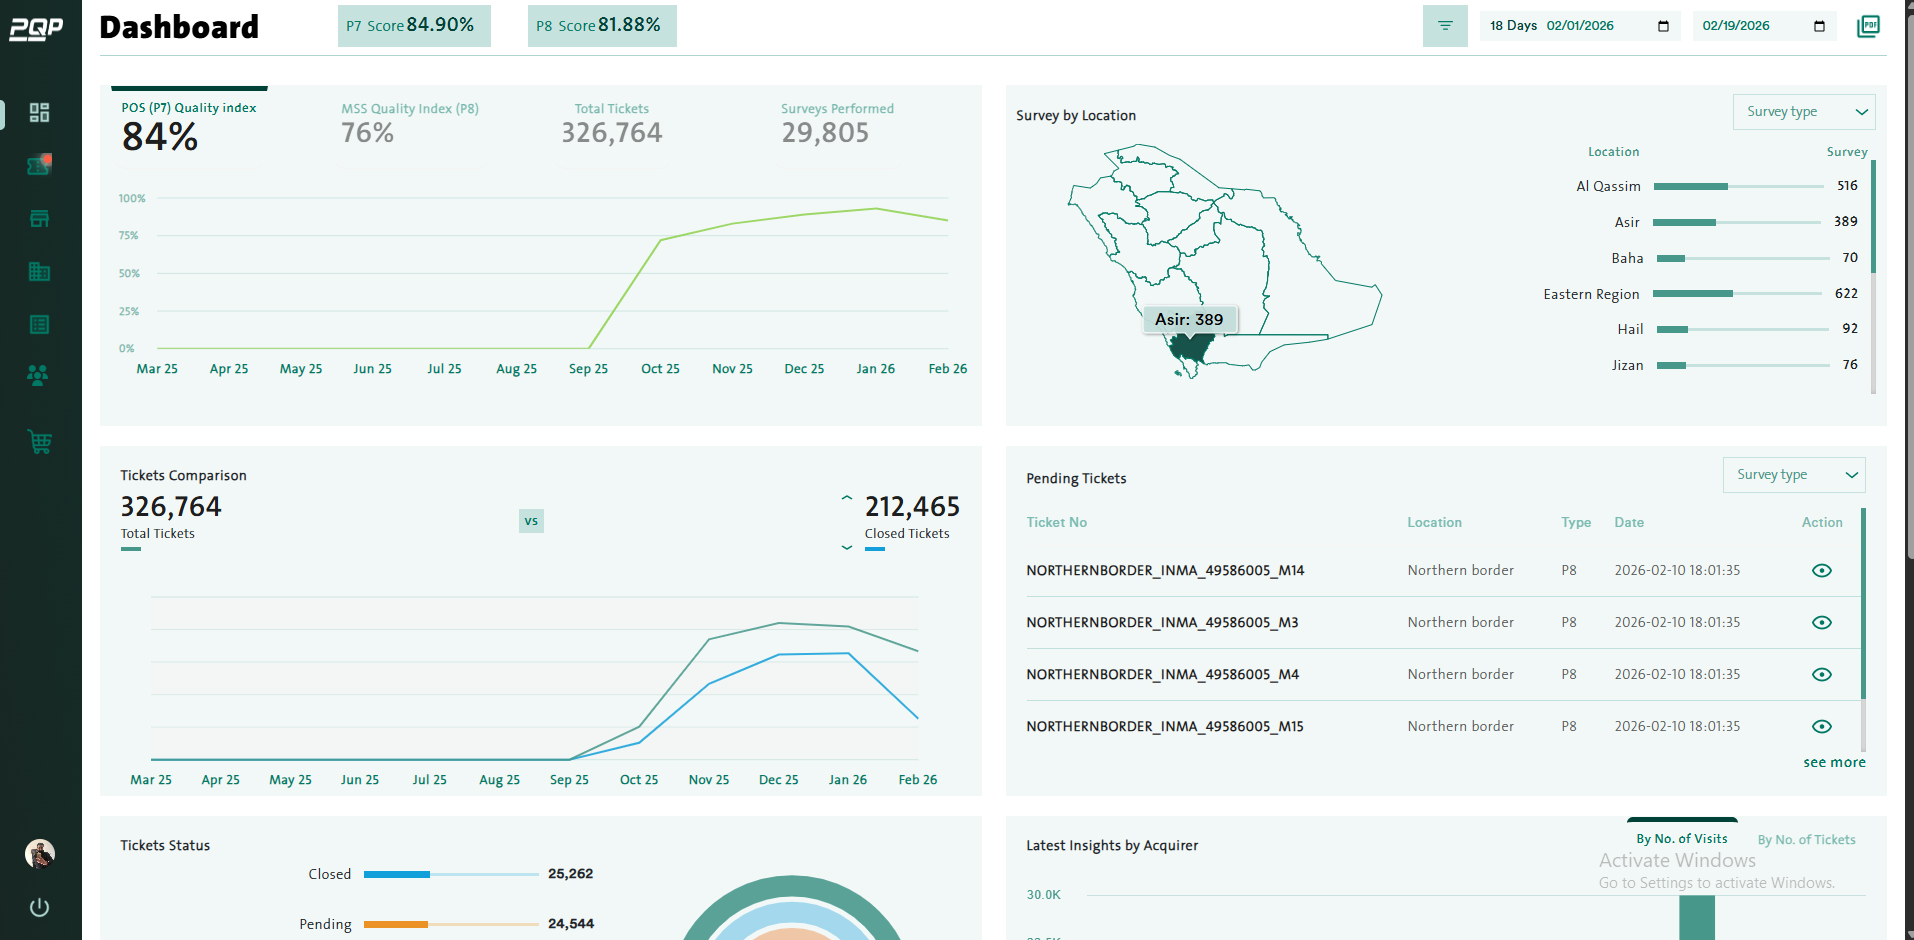
PQP Quality Program Dashboard
PQP’s network operations team relied on disconnected spreadsheets to monitor acquiring, settlement, and device uptime, slowing response times.
This project focused on transforming fragmented reporting workflows into a unified, real-time operational intelligence platform. The goal was to eliminate manual reconciliation, reduce downtime visibility gaps, and empower stakeholders with faster decision-making capabilities.
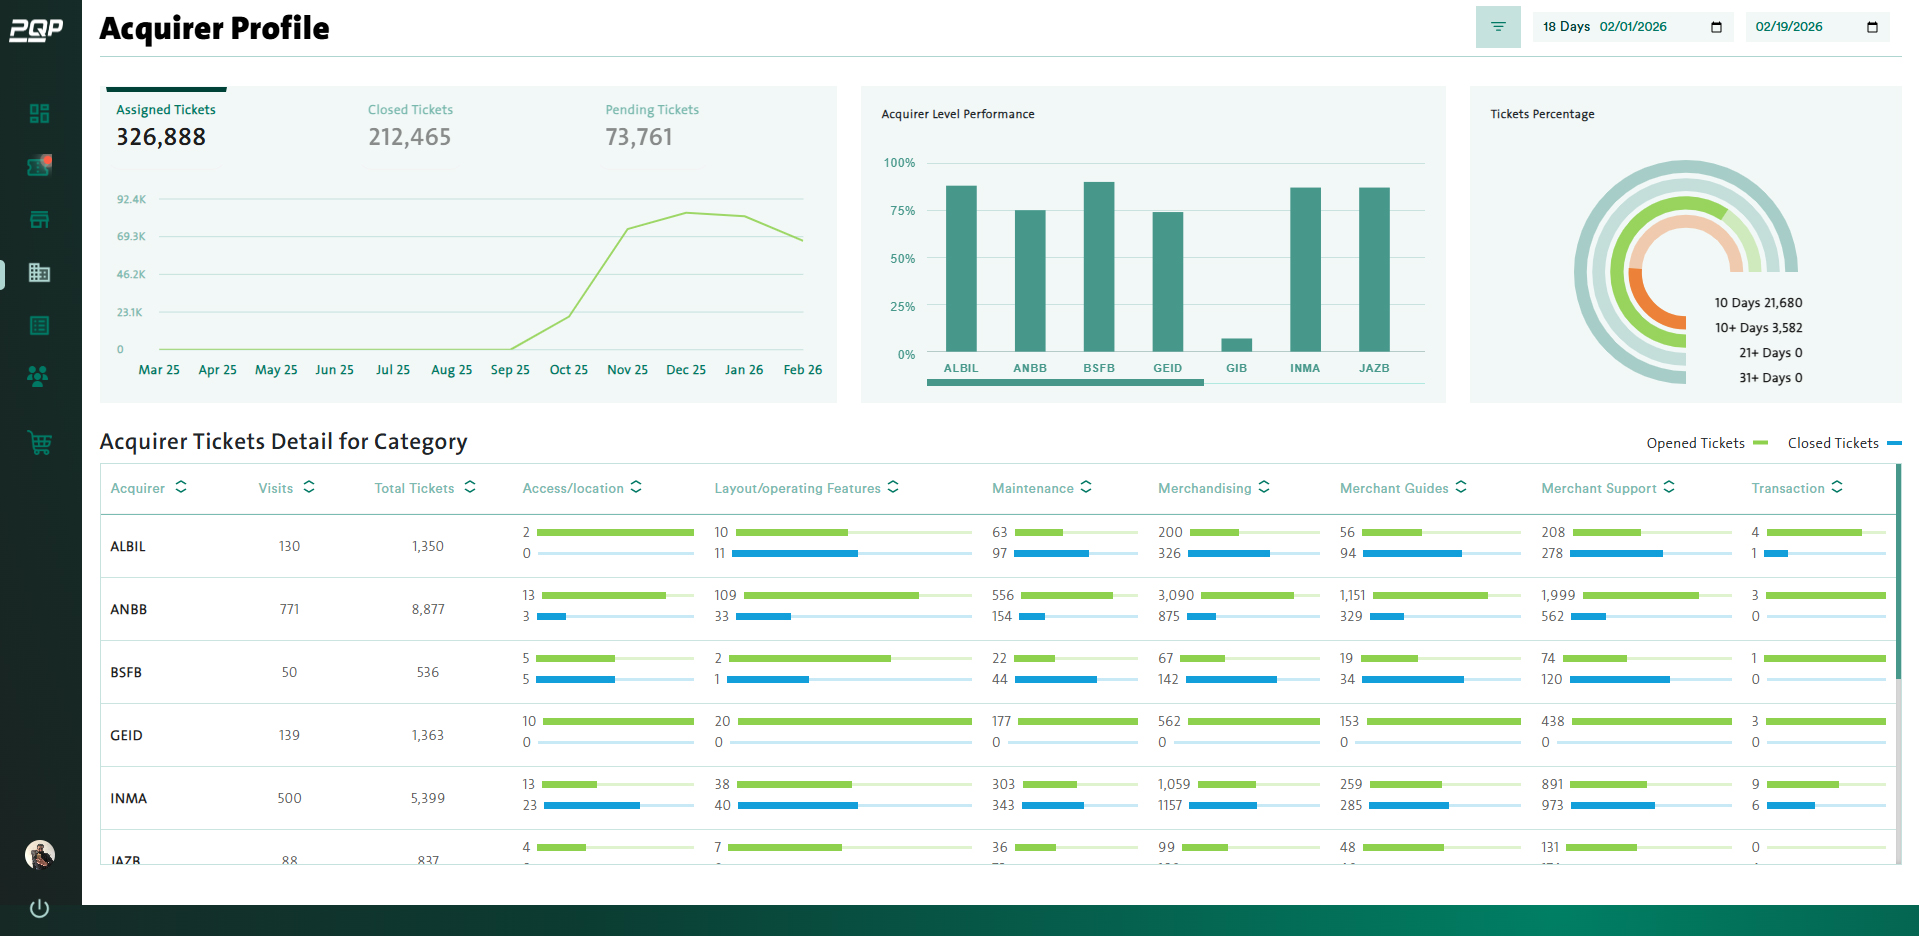
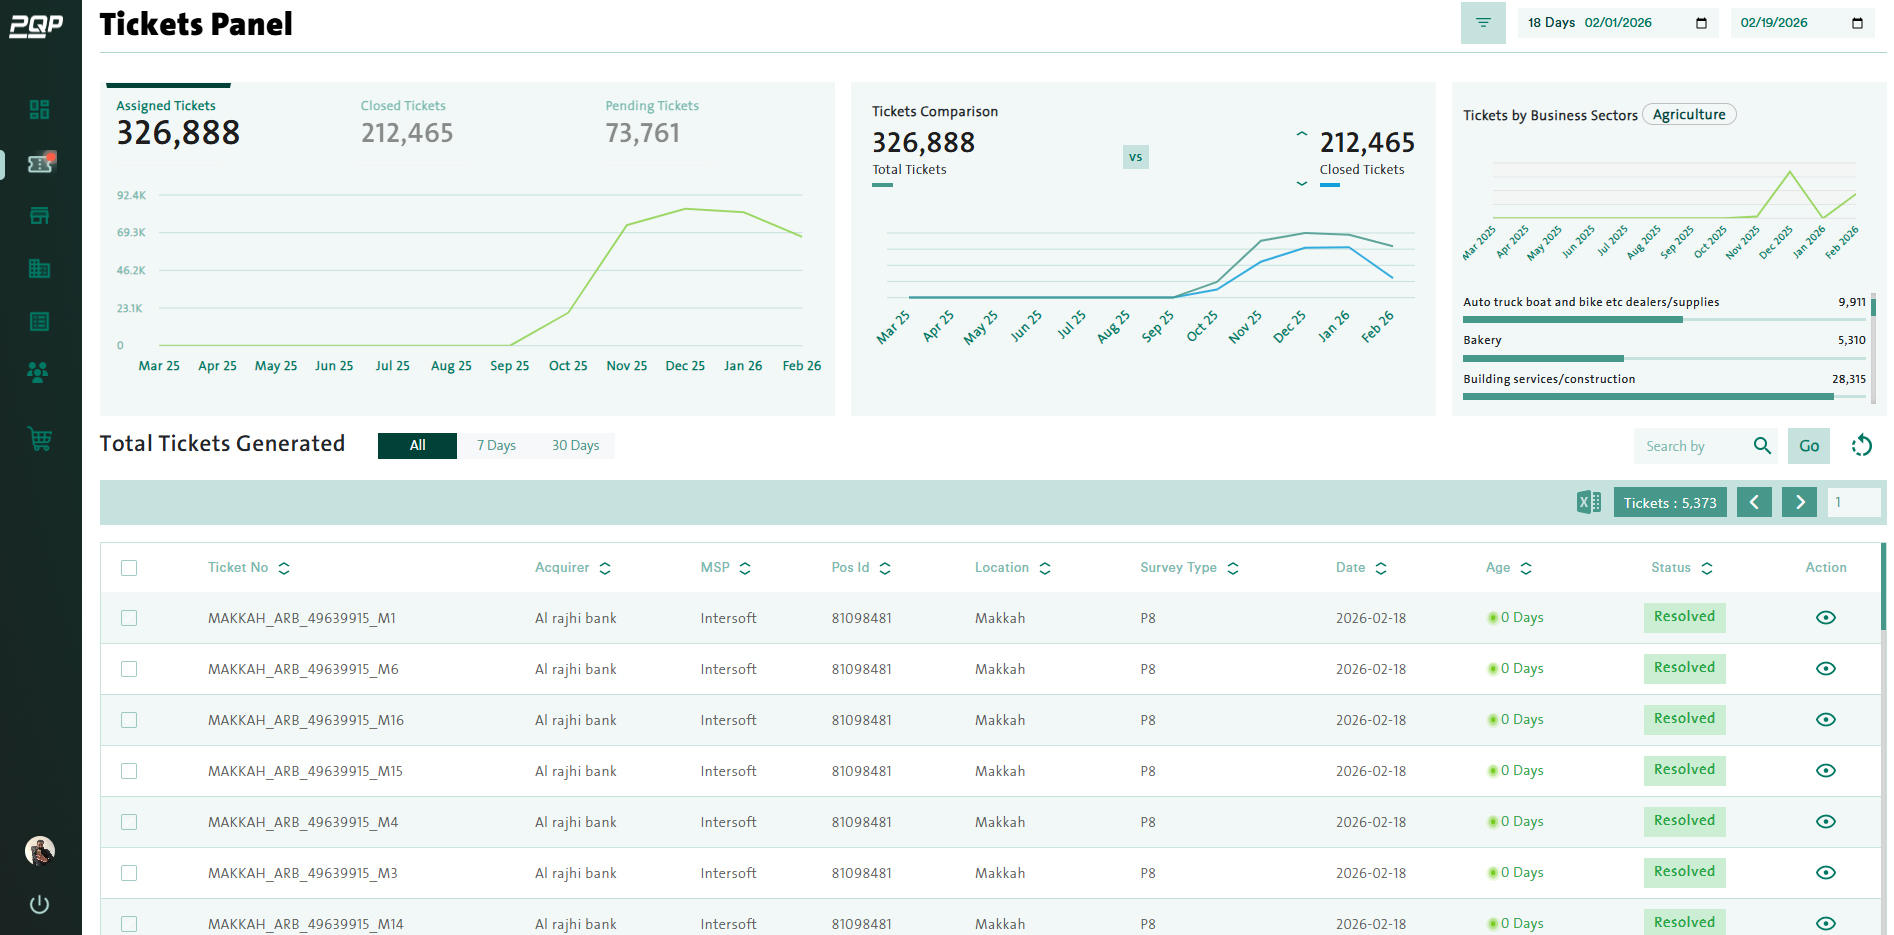
Delivered a unified operations dashboard with streaming data pipelines and granular role-based analytics so teams can drill into 200+ KPIs in minutes.
Challenge
- PQP's network operations team relied on disconnected spreadsheets to monitor acquiring, settlement, and device uptime.
Solution
- Delivered a unified operations dashboard with streaming data pipelines and granular role-based analytics.
Tech Stack
- Next.js · Azure Event Hubs · Power BI · PostgreSQL
Impact
- Cut manual reconciliation work by 58% and surfaced live metrics for 30K+ daily transactions with 99.95% platform availability.